openlayers6地图
大约 3 分钟约 1041 字
openlayers6地图
openlayers官网:https://openlayers.org/
介绍:OpenLayers 可以轻松地将动态地图放置在任何网页中。它可以显示从任何来源加载的地图图块、矢量数据和标记。OpenLayers 的开发是为了进一步使用各种地理信息。它是完全免费的开源 JavaScript,在 2 条款 BSD 许可证(也称为 FreeBSD)下发布。
官方教程:https://openlayers.org/doc/tutorials/concepts.html
快速开始
安装:npm install ol -S
同时使用vue简化开发。
渲染一个地图:
<template>
  <div id="content">
    <div id="map" ref="map"></div>
  </div></template>

<script>
import 'ol/ol.css'
import { Map, View } from 'ol'
import Tile from 'ol/layer/Tile'
import { fromLonLat } from 'ol/proj'
import OSM from 'ol/source/OSM'

export default {
  name: 'tree',
  data () {
    return {
      map: null
    }
  },
  methods: {
    /**
     * 初始化一个 openlayers 地图
     */
    initMap () {
      const target = 'map' // 跟页面元素的 id 绑定来进行渲染
      const tileLayer = [
        new Tile({
          source: new OSM()
        })
      ]
      const view = new View({
        center: fromLonLat([104.912777, 34.730746]), // 地图中心坐标
        zoom: 4.5 // 缩放级别
      })
      this.map = new Map({
        target: target, // 绑定dom元素进行渲染
        layers: tileLayer, // 配置地图数据源
        view: view // 配置地图显示的options配置(坐标系,中心点,缩放级别等)
      })
    }
  },
  mounted () {
    this.initMap()
  }
}
</script>
<style lang="less" scoped>
#content {
  height: 100%;
  width: 100%;

  #map {
    height: 100%;
    width: 100%;
  }
}
</style>
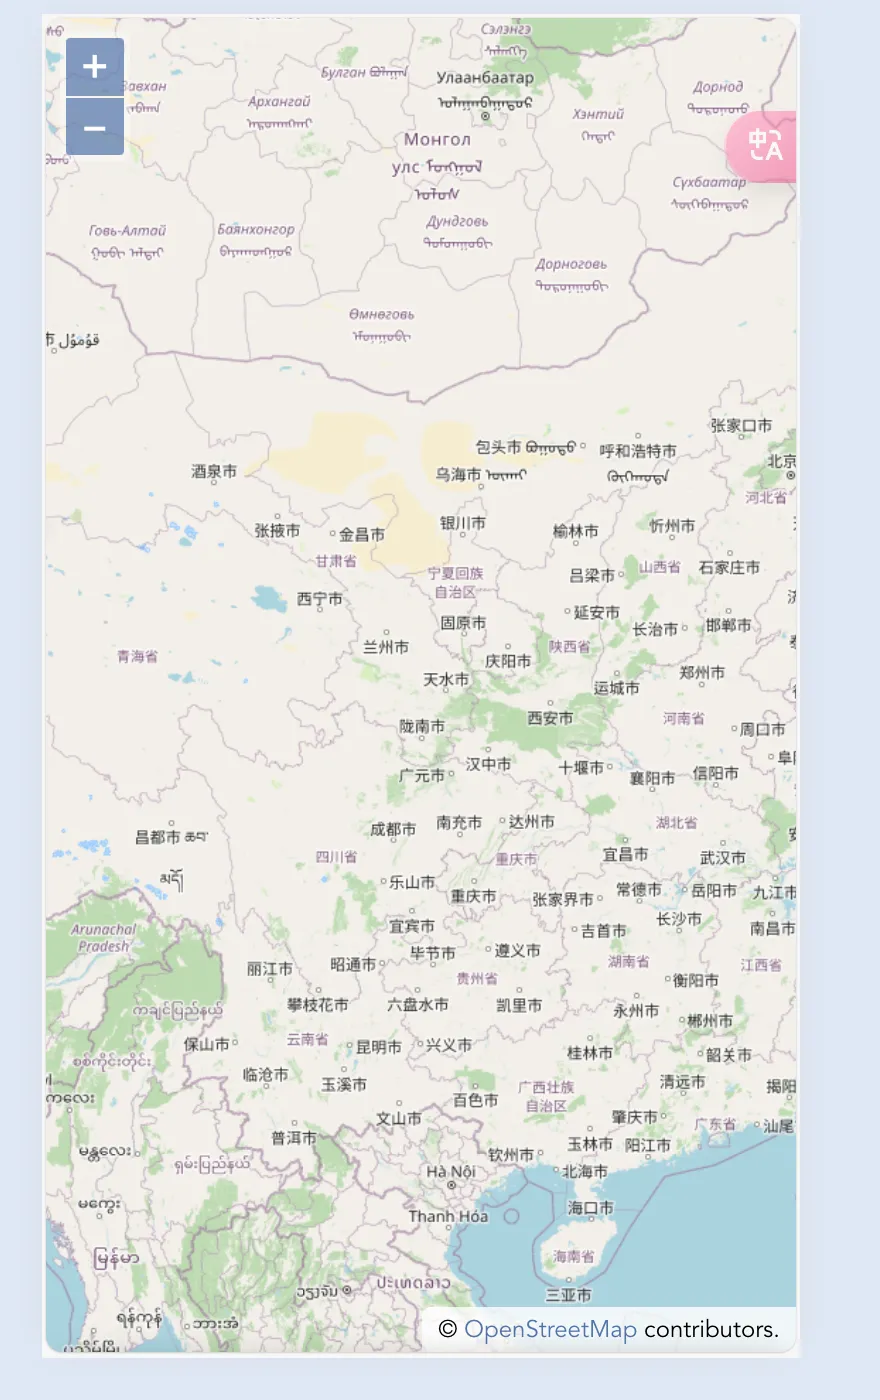
效果如下:

代码解释:<div id="map" ref="map"></div> 需要一个容器用来存放地图,这个容器必须要设置长宽,否则无法显示initMap函数用来初始化地图信息,layer为信息源,view为地图配置,target为容器
图层展示
常见的6种图层
- Tile 图层(瓦片图层):
- 使用瓦片图块构建的图层,常用于显示地图底图。
- 可以通过 URL 请求地图服务(如 OpenStreetMap、Google Maps、Bing Maps 等)来获取瓦片。
- Vector 图层(矢量图层):
- 使用矢量数据渲染的图层,可以显示点、线、面等地理要素。
- 可以使用 GeoJSON、KML、GPX 等格式的数据来创建矢量图层。
- Image 图层(影像图层):
- 可以显示单张或多张图片,常用于叠加卫星影像或其他影像数据。
- 支持显示各种格式的图片,如 PNG、JPEG、GIF 等。
- Heatmap 图层(热力图层):
- 用于显示基于数据密度的热力图。
- 通过对数据点进行权重计算,生成热力图来展示数据分布情况。
- TileGrid 图层(网格图层):
- 用于显示栅格数据,如栅格图、DEM(数字高程模型)等。
- 可以指定栅格的分辨率、范围等参数来显示地形或其他栅格数据。
- Overlay 图层(覆盖图层):
- 用于在地图上添加覆盖物,如标记、信息窗口等。
- 可以将任意 HTML 元素添加到地图上,并控制其位置和样式。
在上面的代码中:
const tileLayer = [
  new Tile({
    source: new OSM()
  })
]
这里可以接受一个数组,也就是可以添加多个图层。
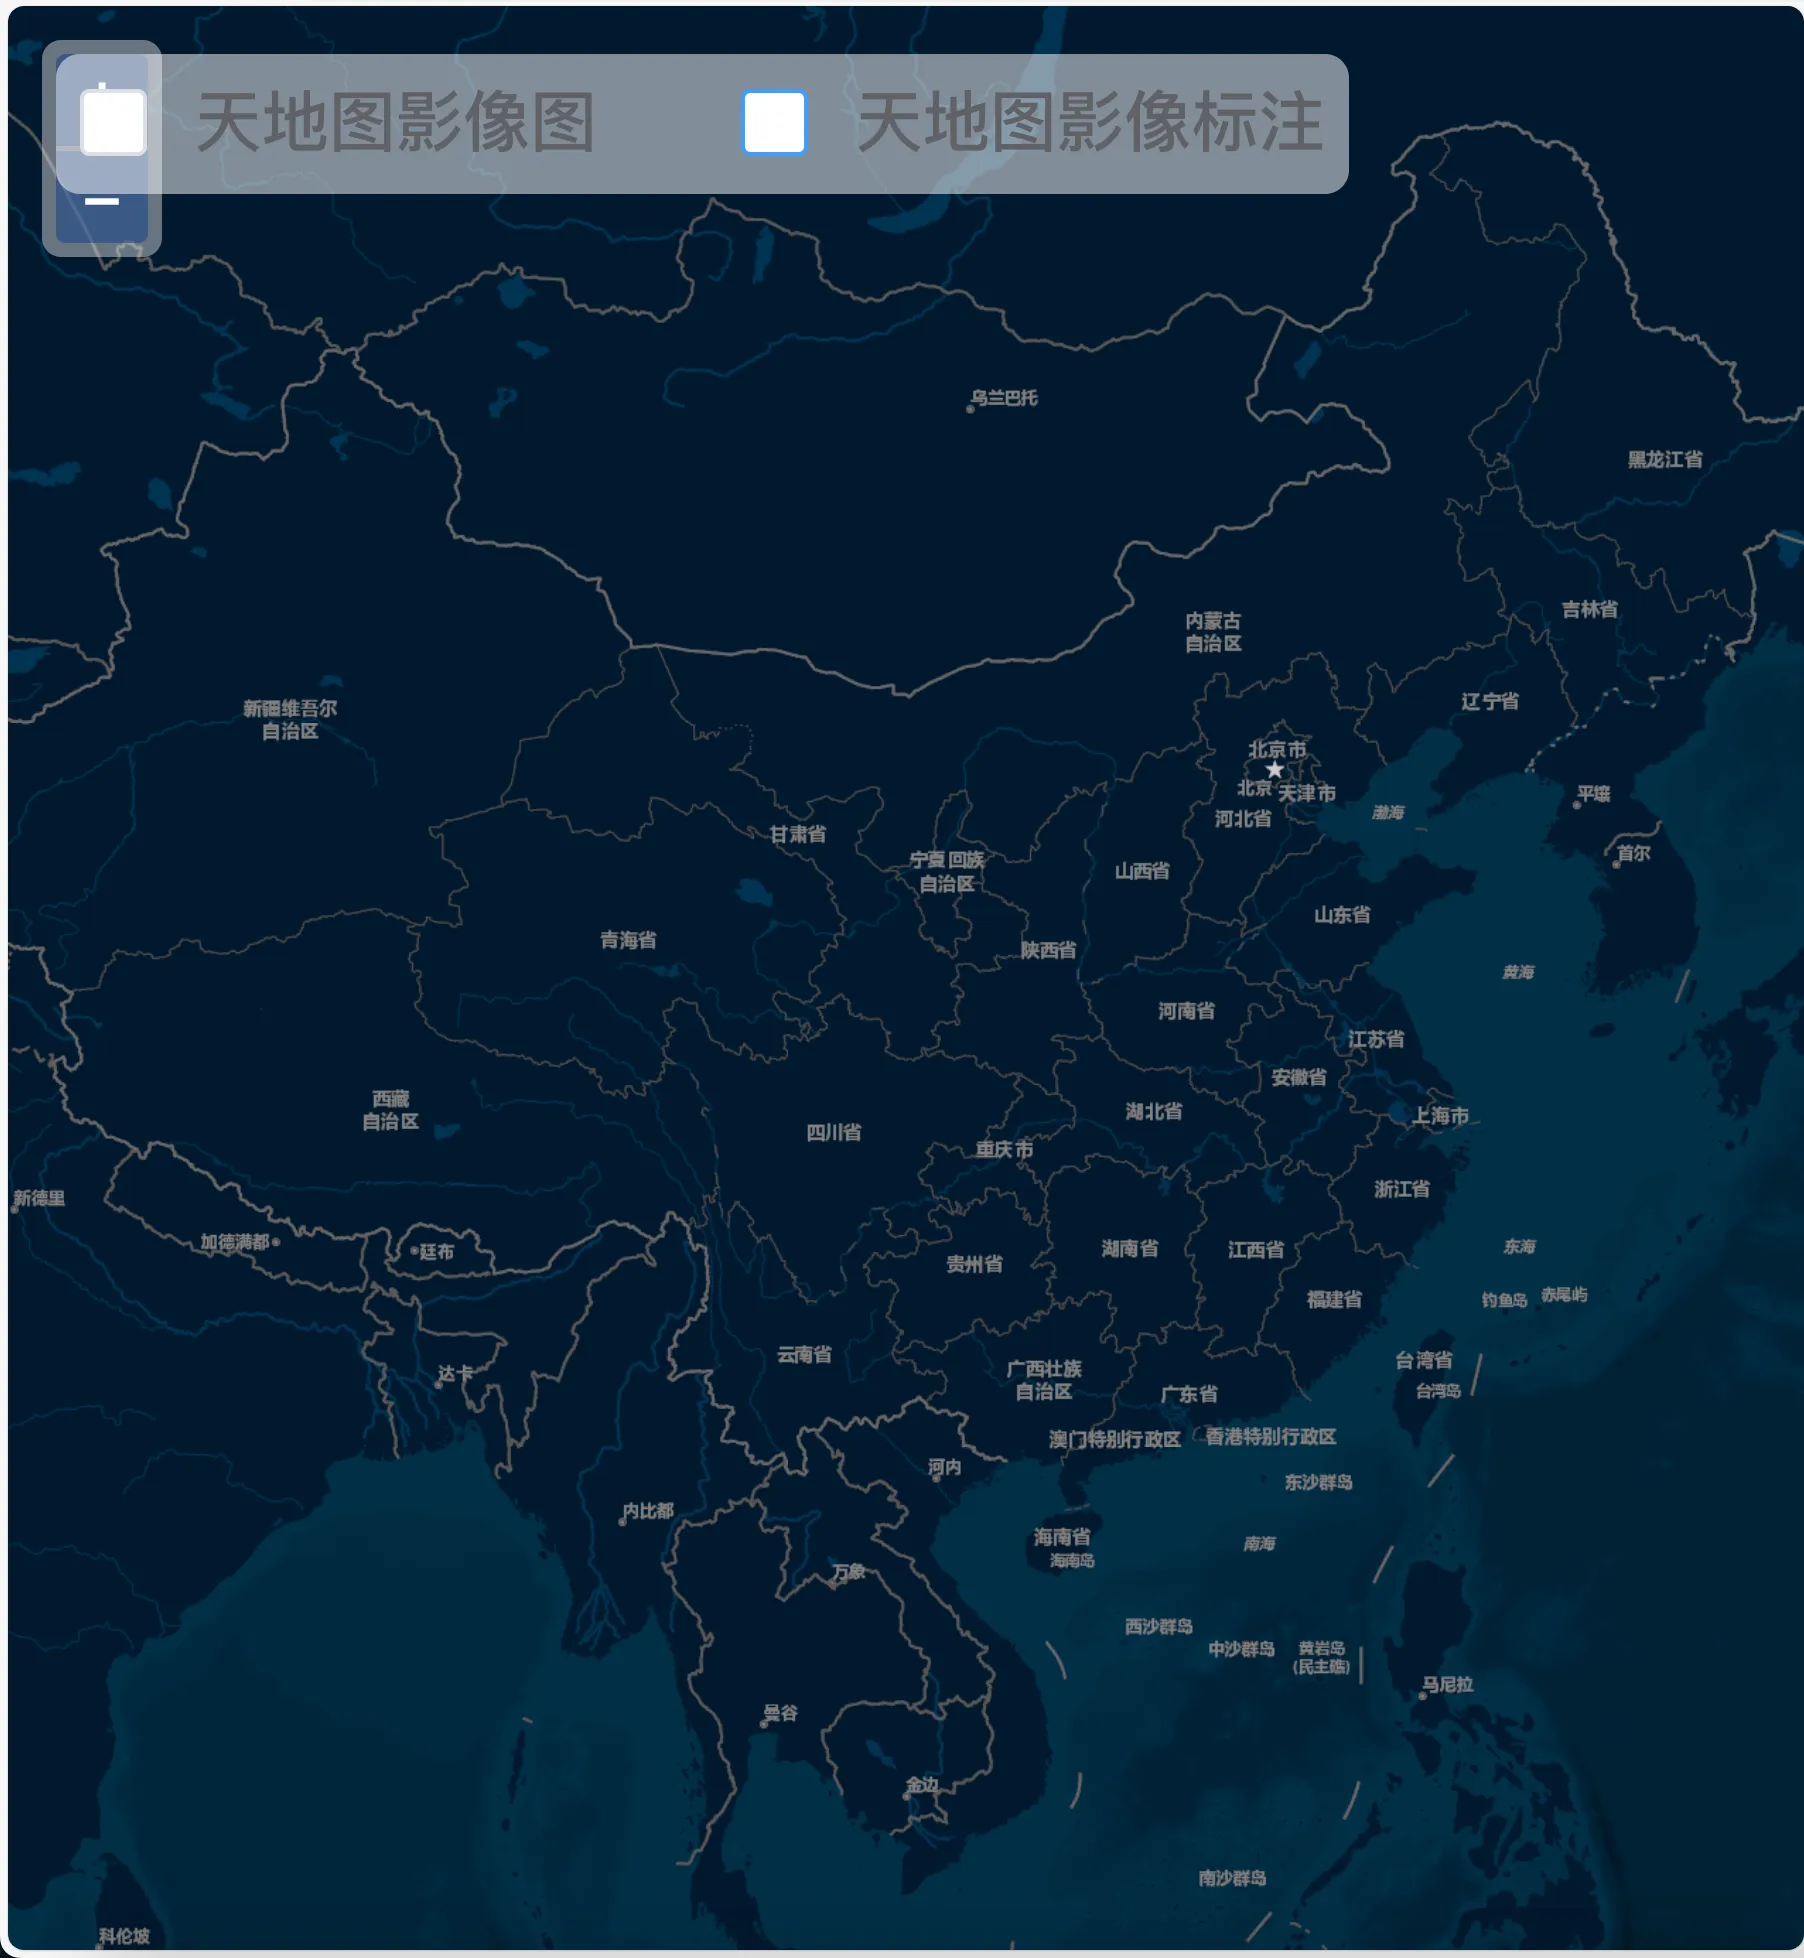
图层切片:
<template>
  <div id="content">
    <div id="map" ref="map"></div>
    <div id="mouse-position">
      <el-checkbox-group v-model="checkList">
        <el-checkbox label="天地图影像图" @change="changImage"></el-checkbox>
        <el-checkbox label="天地图影像标注" @change="changText"></el-checkbox>
      </el-checkbox-group>    </div>  </div></template>
<script>
import 'ol/ol.css'
import { Map, View } from 'ol'
import TileLayer from 'ol/layer/Tile'
import XYZ from 'ol/source/XYZ'
import { fromLonLat } from 'ol/proj'

export default {
  name: 'tree',
  data () {
    return {
      map: null,
      checkList: []
    }
  },
  methods: {
    // 初始化一个 openlayers 地图
    initMap () {
      const target = 'map'
      const tileLayer = [
        new TileLayer({
          source: new XYZ({
            url: 'http://map.geoq.cn/ArcGIS/rest/services/ChinaOnlineStreetPurplishBlue/MapServer/tile/{z}/{y}/{x}'
          })
        })
      ]
      const view = new View({
        center: fromLonLat([104.912777, 34.730746]),
        zoom: 4.5
      })
      this.map = new Map({
        target: target,
        layers: tileLayer,
        view: view
      })
    },
    // 天地图影像图层
    changImage: function (checked, e) {
      if (checked) {
        this.TiandiMap_img = new TileLayer({
          name: '天地图影像图层',
          source: new XYZ({
            url: 'http://t0.tianditu.com/DataServer?T=img_w&x={x}&y={y}&l={z}&tk=5d27dc75ca0c3bdf34f657ffe1e9881d', // parent.TiandituKey()为天地图密钥
            wrapX: false
          })
        })
        // 添加到地图上
        this.map.addLayer(this.TiandiMap_img)
      } else {
        this.map.removeLayer(this.TiandiMap_img)
      }
    },
    // 天地图影像注记图层
    changText: function (checked, e) {
      if (checked) {
        this.TiandiMap_cia = new TileLayer({
          name: '天地图影像注记图层',
          source: new XYZ({
            url: 'http://t0.tianditu.com/DataServer?T=cia_w&x={x}&y={y}&l={z}&tk=5d27dc75ca0c3bdf34f657ffe1e9881d', // parent.TiandituKey()为天地图密钥
            wrapX: false
          })
        })
        // 添加到地图上
        this.map.addLayer(this.TiandiMap_cia)
      } else {
        this.map.removeLayer(this.TiandiMap_cia)
      }
    }
  },
  mounted () {
    this.initMap()
  }
}
</script>
<style lang="less" scoped>
#content {
  width: 100%;
  height: 100%;

  #map {
    width: 100%;
    height: 100%;
  }
}

#mouse-position {
  position: absolute;
  top: 10px;
  left: 10px;
  z-index: 1000;
  background-color: rgba(255, 255, 255, 0.5);
  padding: 5px;
  border-radius: 5px;
}
</style>

